What If You Could See Exactly What He* Sees... Before You Take A Trade?
The AI-powered system that does the institutional analysis for you — and teaches you how while it does.
* Michael Huddleston a.k.a. "The Inner Cricle Trader" (ICT)
Look, I'm going to be straight with you.
If you're looking for another indicator that lights up green when you should buy and red when you should sell... this isn't it.
Those things are designed for one purpose: to take your money while giving you the illusion that trading is simple.
It's not simple. And anyone who tells you otherwise is lying to you.
But here's what I've learned after years of watching traders fail and succeed...
"The difference between profitable traders and everyone else isn't talent, luck, or some magic indicator. It's that they understand why price moves — and they have a systematic way of analyzing that, every single time."
That's what the banks and institutions do. They don't look at RSI divergence or MACD crossovers. They look at liquidity. They look at order flow. They look at where the money is positioned and where it's about to move.
And until now, learning to see the market that way took years. Sometimes a decade.
I wanted to change that.
✦
The Problem With "Learning To Trade"
You've probably experienced this yourself:
You watch a YouTube video about ICT concepts and it makes total sense...
Then you sit down at your charts and have no idea what you're looking at
You take a trade based on what you think you learned
It goes against you immediately
You question everything and wonder if this whole thing is even real
Sound familiar?
The problem isn't the concepts. The problem is the gap between understanding something and being able to apply it in real-time.
That gap is where most traders die.
They understand the theory but can't execute in practice. So they keep losing money while they "learn" — which, let's be honest, could take years.
What if there was a way to bridge that gap?
What if you could have a professional analyst sitting next to you, looking at your charts, explaining exactly what they see, and telling you what to do — while teaching you why?
✦
Introducing ICT Mentor Pro
This is not an indicator. It's not a signal service. And it's definitely not a "get rich quick" scheme.
It's an AI-powered analysis system that does complete institutional-grade analysis on any chart you give it.
Here's what happens when you upload a chart:
1
Higher Timeframe Analysis
The AI identifies the institutional narrative. Where is the market coming from? Where is liquidity resting? What are the banks likely trying to do? You get a complete breakdown — not just "bullish" or "bearish" but the actual why.
2
Mid-Timeframe Analysis
Now we zoom in. The AI looks for structure shifts, order blocks, fair value gaps, and liquidity pools. It tells you exactly what to look for and where to look for it.
3
Entry Timeframe Analysis
This is where it gets specific. The AI gives you precise entry zones, stop loss levels, and take profit targets — all based on institutional concepts. Not random numbers. Calculated levels.
4
Outcome Review
After the trade plays out, you come back. The AI analyzes what actually happened, explains why it worked (or didn't), and helps you learn from the outcome. This is where the real education happens.
By the time you're done, you don't just have a trade idea. You have a complete, well-founded thesis that you actually understand.
And here's the beautiful part...
The more you use it, the less you need it. Because you're not just getting analysis — you're learning to see the market the way professionals do.
✦
Earn While You Learn. Learn While You Earn.
Most trading education has a fundamental problem: you have to lose money for years before you can make money.
That's backwards.
With ICT Mentor Pro, you can take high-quality trades while you're still learning the concepts. The AI handles the heavy lifting of analysis while you develop your eye.
Think about it like having training wheels that actually help you win races — and that gradually come off as you get better.
You stop taking random trades based on gut feeling or half-understood concepts
You start understanding why price moves instead of just reacting to it
You build real confidence because your trades are based on solid analysis
You accelerate your learning curve from years to months
You journal automatically so you can review and improve
This is what professional development actually looks like. Not watching another course. Not paper trading for two years. Actually trading, with guidance, and getting better every day.
✦
"But Can AI Really Analyze Charts?"
Good question. Healthy skepticism.
Here's the thing: we're not using some generic chatbot here.
Over 12 Months of Teaching This Thing
I started working on this AI over a year ago. And I'm still teaching it today.
Every week, I review its analyses. When it misses something, I correct it. When it nails a call, I reinforce why. When new patterns emerge in the market, I teach it those too.
It's learned from hundreds of chart analyses. Thousands of corrections. Countless edge cases and market conditions.
This isn't a "set it and forget it" AI tool that someone built in a weekend. It's a continuously evolving system that gets smarter every single week.
And honestly? It's better than I was after my first three years as a Charter Member personally trained by ICT himself. Because it's learned from all my mistakes without having to make them.
The AI has been specifically trained to analyze charts using ICT and Smart Money Concepts. It looks for:
Liquidity pools (buy-side and sell-side)
Order blocks and breaker blocks
Fair value gaps and imbalances
Market structure shifts
Displacement and manipulation patterns
Optimal trade entries and institutional levels
And it doesn't just identify these things — it explains them in context. Why does this order block matter? Where is the liquidity that price is likely targeting? What would invalidate this thesis?
You get the kind of analysis that would take a professional trader 20-30 minutes to do... in seconds.
Here's What This Looks Like In Practice
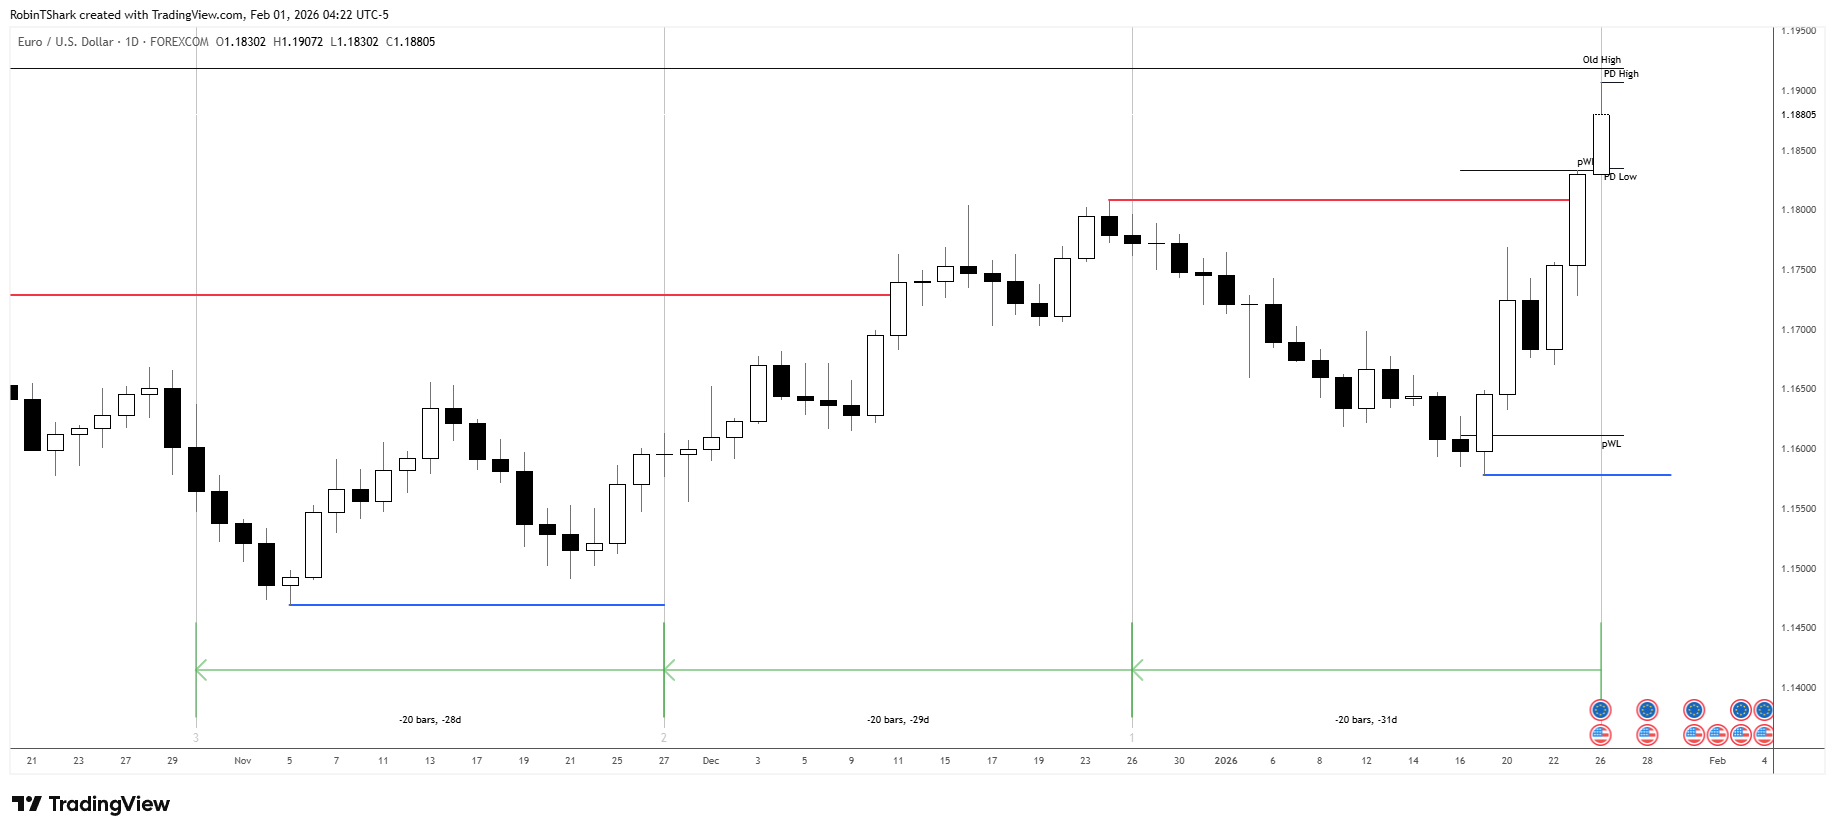
You upload your Daily chart of EUR/USD. Within seconds, you get:
Based on the provided Daily (1D) chart for EUR/USD, here is the HTF analysis using ICT Institutional Order Flow principles:
1. Daily Bias: Bullish
The current bias is strongly Bullish. This is confirmed by the massive Displacement away from the 1.16000 level. We are seeing a classic "Expansion" phase of the Institutional Price Delivery Algorithm (IPDA).
C3 Bullish Logic: The price action leading into the current candle shows a clear violation of the Previous Daily High (PD High) with a close well above it, following a successful sweep of the Previous Weekly Low (pWL).
2. Draw on Liquidity (DOL)
Primary DOL:Old High / Buy-Side Liquidity (BSL) located at the 1.19300 – 1.19500 level (marked as "Old High" at the top right of your chart).
Secondary DOL (Internal): Should a retracement occur, the market will look to fill the large Fair Value Gap (FVG) created by the most recent expansion candle, specifically targeting the 1.17500 level (the previous red resistance line now acting as a support/breaker).
3. Reasoning: Market Structure & Premium/Discount
Market Structure Shift (MSS): Price recently swept a significant HTF Liquidity pool (blue line at ~1.15800). Following this sweep, price exhibited a violent shift in market structure, breaking through the previous swing high (red line) with high momentum. This indicates that the "Smart Money" has shifted from accumulation to distribution at higher prices.
Change in State of Delivery (CISD): The aggressive nature of the last two candles confirms a CISD. Price is no longer respecting bearish PD Arrays; instead, it is treating old resistance (the red line) as a launchpad.
Premium vs. Discount:
Price originated from a HTF Discount (below the blue liquidity line).
While price is currently entering a Premium relative to the recent swing, the lack of any bearish SMT or reversal signatures suggests the algorithm is "seeking" the external Buy-Side Liquidity at the 1.19500 level before any significant rebalancing occurs.
Confinement: Price is currently trading outside the previous 20-day range, indicating a trending environment where we expect "Expansion" candles to continue until the DOL is reached.
Mentor Note: Look for entries on the M15/M5 timeframes during the London or NY Killzones using the FVG within the current daily candle's range as your anchor for long positions. Avoid shorting until the "Old High" is tagged and a MSS occurs on the lower timeframes.
That's not vague. That's actionable. That's what institutional traders actually think about.
If you want to see the action rapports from the complete Topdown Analyses (all 4 ), you can view them below:
You're serious about understanding institutional trading concepts
You're tired of indicators that promise the world and deliver nothing
You want to actually learn, not just follow signals blindly
You're willing to put in the work to become a better trader
You understand that good trading is about process, not predictions
This is NOT for you if:
You want a "push button" system that trades for you
You're looking for guaranteed profits (nothing can guarantee that)
You're not willing to learn the underlying concepts
You expect to get rich overnight
You blame tools instead of taking responsibility for your trades
I'm being direct because I only want serious traders using this. If you're not committed to actually improving, please don't sign up. You'll waste your money and my time.
But if you're ready to finally trade with clarity and confidence...
Ready To See The Market Differently?
Start with 12 free analyses per week. No credit card required. See for yourself if this is what your trading has been missing.
Free
$0
3 full topdown analyses (12 Screenings) Full access to all features/reports
Pro
$29
5 Full Topdown Anslyses (20 Screenings) per week Enough to get you funded!Priority support
Institutional
$89
Unlimited analyses Backtesting available (fair use policy applies)
No. The system explains everything as it analyzes. You'll learn the concepts through the analysis itself. That said, having some basic understanding will help you get more out of it.
What markets does this work for?
Any market with a chart. Forex, indices, crypto, stocks — the institutional concepts apply everywhere. Liquidity is liquidity.
How is this different from other AI trading tools?
Most AI trading tools try to predict price direction. We don't predict — we analyze. There's a huge difference. We help you understand the current market context and identify high-probability setups based on institutional concepts. The decision is always yours.
What do I need to use it?
Just a browser and charts to upload. You'll set up a free Gemini API key (takes 2 minutes) — we use that for basic chart preprocessing only. Why? Because it would be wasteful to spend our custom ICT Engine tokens on standard processing. The real institutional analysis comes from our proprietary ICT Engine that we've trained for over 12 months.
Is my data secure?
Yes. Your charts are analyzed and stored encrypted. Your API key is encrypted. We don't share anything with anyone. Ever. if you decide to leave, just ask us to delete all your records and it's gone.
What if I don't like it?
Then stop using it. There's a free tier — try it first. If it's not for you, no hard feelings. But I think you'll be surprised at how useful it is.
✦
One Last Thing...
I built this because I was tired of watching good people lose money while trying to learn how to trade.
The education system in trading is broken. People sell courses for $2,000 that leave you more confused than when you started. Signal services turn you into a dependent who can't think for themselves. And indicators... well, you know how that goes.
What if we could flip the model?
What if instead of paying to learn and then hoping you can eventually make money... you could make money while learning?
That's what ICT Mentor Pro is designed to do.
It's training wheels that actually work. It's a mentor that's available 24/7. It's institutional-grade analysis without the institutional-grade price tag.
By accessing or using ICT Mentor Pro ("the Service"), you agree to be bound by these Terms of Service. If you do not agree to these terms, please do not use our Service.
2. Description of Service
ICT Mentor Pro is an educational tool that provides AI-powered chart analysis based on institutional trading concepts. The Service is designed to help traders understand market structure and improve their analysis skills.
3. User Accounts
To use certain features of the Service, you must create an account. You are responsible for:
Maintaining the confidentiality of your account credentials
All activities that occur under your account
Notifying us immediately of any unauthorized use
4. API Keys
The Service may require you to provide your own API key (e.g., Google Gemini API key). You are solely responsible for:
Obtaining and managing your API keys
Any costs associated with your API usage
Compliance with the API provider's terms of service
5. Subscription and Payments
Paid subscriptions are billed on a recurring basis. You may cancel at any time, but no refunds will be provided for partial billing periods. We reserve the right to modify pricing with 30 days notice.
6. Prohibited Uses
You agree not to:
Use the Service for any illegal purpose
Attempt to reverse engineer or copy the Service
Share your account with others
Redistribute analysis results commercially without permission
Interfere with or disrupt the Service
7. Disclaimer of Warranties
THE SERVICE IS PROVIDED "AS IS" WITHOUT WARRANTIES OF ANY KIND. WE DO NOT GUARANTEE THE ACCURACY, COMPLETENESS, OR USEFULNESS OF ANY ANALYSIS PROVIDED. TRADING INVOLVES SUBSTANTIAL RISK OF LOSS.
8. Limitation of Liability
ICT Mentor Pro shall not be liable for any indirect, incidental, special, consequential, or punitive damages, including loss of profits, data, or trading losses, arising from your use of the Service.
9. Not Financial Advice
The Service does not provide investment, financial, legal, or tax advice. All analysis is for educational purposes only. You should consult qualified professionals before making any financial decisions.
10. Modifications
We reserve the right to modify these Terms at any time. Continued use of the Service after changes constitutes acceptance of the new Terms.
11. Termination
We may terminate or suspend your account at any time for violation of these Terms or for any other reason at our sole discretion.
12. Governing Law
These Terms shall be governed by the laws of the State of Delaware, United States, without regard to conflict of law principles.
13. Contact
For questions about these Terms, please contact us through the support ticket system in your account settings.
Privacy Policy
Last Updated: February 2026
1. Introduction
ICT Mentor Pro ("we", "our", or "us") is committed to protecting your privacy. This Privacy Policy explains how we collect, use, and safeguard your information when you use our Service.
2. Information We Collect
Account Information:
Email address (for authentication)
Name (optional, for personalization)
Account creation date
Usage Data:
Number of analyses performed
Subscription tier and status
Feature usage patterns
Chart Data:
Chart images you upload for analysis
Analysis results and journal entries
3. Information We Do NOT Collect
We do not store your actual API key on our servers - it is encoded and stored locally in your browser
We do not track your browsing activity outside our Service
We do not sell your personal information to third parties
4. How We Use Your Information
We use collected information to:
Provide and maintain the Service
Process your chart analyses
Track usage for subscription limits
Improve our AI analysis capabilities
Communicate with you about the Service
Provide customer support
5. Data Storage and Security
Your data is stored on secure servers with encryption at rest. Chart images and analysis data are associated with your account. We implement industry-standard security measures to protect your information.
6. Data Retention
We retain your data for as long as your account is active. Upon account deletion request, we will permanently delete all your data within 30 days, except where retention is required by law.
7. Third-Party Services
Our Service integrates with:
Google Gemini API: For basic chart processing. Your API key is used directly from your browser - we never see or store your actual key.
Authentication Providers: For secure login (Google OAuth where applicable).
These services have their own privacy policies that govern their use of your data.
8. Your Rights
You have the right to:
Access your personal data
Request correction of inaccurate data
Request deletion of your data
Export your journal entries
Opt out of non-essential communications
9. Cookies
We use essential cookies for authentication and session management. We do not use tracking cookies or third-party advertising cookies.
10. Children's Privacy
Our Service is not intended for users under 18 years of age. We do not knowingly collect information from children.
11. International Data Transfers
Your data may be transferred to and processed in the United States. By using the Service, you consent to this transfer.
12. Changes to This Policy
We may update this Privacy Policy from time to time. We will notify you of significant changes by email or through the Service.
13. Contact Us
If you have questions about this Privacy Policy or wish to exercise your data rights, please contact us through the support ticket system in your account settings, or email us at privacy@ictmentorpro.com.